Zero-Lag RSI DivergenceZero-Lag RSI Divergence
Overview
This indicator identifies RSI divergences in real-time without delay, providing immediate signals as price-momentum discrepancies develop. The indicator analyzes price action against RSI momentum across dual configurable periods, enabling traders to detect potential reversal opportunities with zero lag.
Key Features
Instant Divergence Detection : Identifies bullish and bearish divergences immediately upon formation without waiting for candle confirmation or historical validation. This eliminates signal delay but may increase false signals due to higher sensitivity.
Dual Period Analysis : Configure detection across two independent cycles - Short Period (default 15) and Long Period (default 50) - allowing for multi-timeframe divergence analysis and enhanced signal validation across different market conditions.
Visual Divergence Lines : Automatically draws dashed lines connecting divergence points between price highs/lows and corresponding RSI peaks/troughs, clearly illustrating the momentum-price relationship.
Customizable RSI Parameters : Adjustable RSI length (default 14) allows optimization for different market volatility and trading timeframes.
How It Works
The indicator continuously monitors price action patterns and RSI momentum:
- Bullish Divergence : Detected when price makes lower lows while RSI makes higher lows, suggesting potential upward momentum
- Bearish Divergence : Identified when price makes higher highs while RSI makes lower highs, indicating potential downward momentum
The algorithm uses candle color transitions and immediate RSI comparisons to trigger signals without historical repainting , ensuring backtesting accuracy and real-time reliability.
How To Read
Important Notes
Higher Signal Frequency : The zero-lag approach increases signal sensitivity, generating more frequent alerts that may include false signals. Consider using additional confirmation methods for trade entries.
Non-Repainting : All signals are generated and maintained without historical modification, ensuring consistent backtesting and forward-testing results.
Input Parameters
RSI Length: Period for RSI calculation (default: 14)
Short/Long Periods: Lookback periods for divergence detection (default: 15/50)
Line Colors: Customizable colors for short and long period divergence lines
Label Settings: Optional divergence labels with custom text
This indicator is designed for traders seeking immediate divergence identification across multiple timeframes while maintaining signal integrity and backtesting reliability.
Komut dosyalarını "rsi divergence" için ara

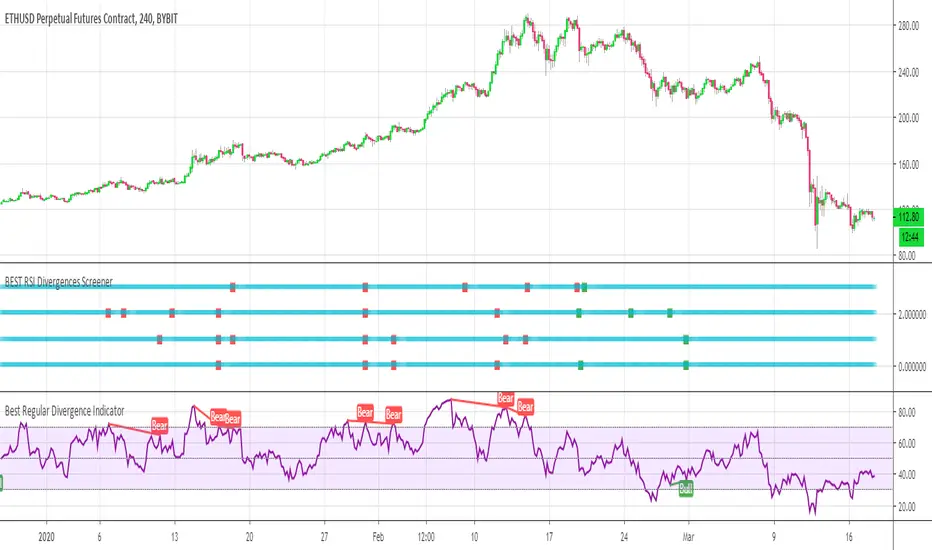
BEST RSI Divergences ScreenerHello traders
I hope you're all hanging on at home with what's going on these days...
The good news is.... it gives us more time to trade ^^.... #positive #attitude
I - Concept
This screener detects whether the regular RSI divergences based on the TradingView Divergence built-in indicator (made by the gentleman @everget I believe)
With this screener, you can see in 1 view which of your favorite cryptos/stocks/forex pairs/etc. showing strong divergences
The gentlemen (and demoiselles) traders can play with the lookback/ranges inputs to adjust the divergences based on what they think is best of their trading/timeframe/instrument/life
On that script screenshot, I'm showing the BYBIT:BTCUSD part of the screener matching with the divergences on the chart
II - How did I set the screener
The visual signals are as follow:
- square: whenever a divergence is detected
Then the colors are:
- green when there is bullish regular divergence
- red when there is bearish regular divergence
Best regards
Dave
MACD-RSI Divergence OscillatorMACD-RSI Divergence Oscillator: Dual Confirmation with Momentum + Divergence Signals
This powerful oscillator combines MACD and RSI into a single normalized visual tool, enriched with automatic divergence detection and smart signal alerts. It’s designed to give traders advanced insights into momentum shifts and trend reversals.
Key Features:
• MACD + RSI Combo: Both indicators are scaled and merged into one oscillator for clearer interpretation.
• Automatic Divergence Detection:
• Bullish & Bearish divergences on both MACD and RSI
• Highlights strong divergences when both confirm
• Trading Signals:
• Detects MACD crossovers and RSI reversals
• Smart buy/sell signals based on momentum + divergence
• Custom Oscillator View:
• Plots MACD and RSI on the same scale
• Visual zero-line, overbought/oversold levels, and customizable colors
• Optional Dashboard Table:
• Displays live indicator values, signal states, and divergence status
Ideal For:
• Spotting early trend reversals
• Confirming trade entries/exits
• Avoiding false signals using dual indicator logic
Highly customizable and suitable for all timeframes and asset types.

Triple RSI DivergenceTriple rsi divergence
Sure! Here's a clear explanation in English of the Triple RSI Divergence Pine Script I shared earlier:
---
Explanation of the Triple RSI Divergence Pine Script
This Pine Script is designed to detect triple divergence patterns between the RSI (Relative Strength Index) and price action, which can signal potential trend reversals.
---
What is Triple Divergence?
Triple divergence occurs when price creates three consecutive higher highs (in an uptrend) or lower lows (in a downtrend), while the RSI moves in the opposite direction — forming lower highs or higher lows respectively.
This pattern is considered a strong reversal signal because it indicates momentum is weakening despite price continuing its trend.
---
What This Script Does:
Calculates RSI (14-period)
Identifies three recent highs/lows in price and RSI
Checks for:
Bearish triple divergence: price makes 3 higher highs, RSI makes 3 lower highs.
**Bullish

Prices / RSI divergences detectorPrices / RSI divergences detector.
Display both hidden and regular divergences.
I used it with my own RSI indicator. You can find the script here:
[Sisyphe] rsi divergences [RSI side]This indicator must be completed by rsi divergences
It plots rsi regular divergences until five levels back and prioritize the largest divergence.
[Sisyphe] rsi divergences [chart side]This indicator must be completed by rsi divergences
It plots rsi regular divergences until five levels back and prioritize the largest divergence.
Advanced RSI Divergence & Signal TrackerThis indicator offers a unique edge over traditional RSI divergence tools by supporting both Live and Confirmed modes of divergence detection.
Key Features:
Two Detection Modes
- Live Mode: Detects divergences as price moves. Ideal for faster signal generation when early entries matter. Only the most recent signal may repaint to stay aligned with live market data.
- Confirmed Mode: Waits for full pivot confirmation before signaling. This results in more stable, but delayed, signals — great for traders who prefer validation over speed.
Multiple Divergence Types
Supports detection and visualization for the following:
- Bullish Divergence
- Hidden Bullish Divergence
- Bullish Convergence
- Bearish Divergence
- Hidden Bearish Divergence
- Bearish Convergence
Each signal is marked directly on the RSI chart with labeled lines for clarity.
RSI Signal Tracker Panel
A built-in, optional status table displays:
- Current signal type
- RSI value at the signal
- Price at the signal
- Age of the signal (in bars)
- Previous signal (if enabled)
Fully customizable in the settings — show only what you want to see.
Alerts Included
Alerts are available for all divergence and convergence signal types.
This indicator is designed for traders who want flexibility — whether you need early signals or prefer confirmed ones. Perfect for both reversal and trend-following strategies, with complete control over what is shown on your chart.

TDI - Traders Dynamic Index + RSI Divergences + Buy/Sell SignalsTraders Dynamic Index + RSI Divergences + Buy/Sell Signals
Credits to LazyBear (original code author) and JustUncleL (modifications)..
I added some new features:
1- RSI Divergences (Original code from 'Divergence Indicator')
2- Buy/Sell Signals with alerts (Green label 'Buy' - Red label 'Sell')
3- Background colouring when RSI (Green line) crosses above MBL (yellow line)
- Buy and Sell Signals are generated using Dean Malone's method (The Author of the TDI indicator) as mentioned in his PDF: (( www.forexfactory.com )), according to:
** Buy (Green Label) = RSI > 50, Red line, & Yellow line
** Sell (Red Label) = RSI < 50, Red line, & Yellow line
- I found that the best quality long trades generated when RSI crosses above red line, yellow line and they are all above 50, and vice versa for sell trades.
-I figured out another way to generate Buy/Sell Signals when RSI crosses above the yellow line, and you can stay with the trade till RSI crosses under the yellow line (I made a background colouring for that to be easily detected)
Hope you all wonderful trades..
مؤلف المؤشر هو (Dean Malone)
وكتب LazyBear كوده في tradingview
وأضاف JustUncleL بعض التعديلات عليه
أضفت إليه بعض المزايا الأخرى المتمثلة في:
1- رصد انحرافات مؤشر القوة النسبية
2- إشارات بيع وشراء بناء على طريقة مؤلف المؤشر
3- تظليل بالأخضر للمنطقة التي يعبر فيها مؤشر القوة النسبية الخط الأوسط (الخط الأصفر)
إشارات البيع والشراء تكون كالتالي:
** الشراء عندما يكون مؤشر القوة النسبية فوق الخط الأحمر وفوق خط الـ 50 وفوق الخط الأصفر
** البيع عندما يكون مؤشر القوة النسبية تحت الخط الأحمر وتحت خط الـ 50 وتحت الخط الأصفر
** أفضل إشارات الشراء حينما يعبر مؤشر القوة النسبية فوق الخط الأحمر والأصفر، ويكونوا جميعا فوق خط الـ 50، والعكس بالنسبة لإشارات البيع
يمكن استخدام المؤشر في دخول صفقات متوسط المدى، وذلك عندما يعبر مؤشر القوة النسبية فوق الخط الأصفر (قمت بتظليل المنطقة بالأخضر لسهولة رصدها) والخروج من الصفقة إذا نزل مؤشر القوة النسبية عن الخط الأصفر،
يرجى التنبه إلى أن الدخول والخروج يكون بأسباب فنية مدروسة، والمؤشر يدعم قراراتك فقط، ولا يمكن الاعتماد عليه منفردا في تحديد نقاط الدخول أوالخروج.
تجارة موفقة لكم جميعا :)

FVG + OB + RSI Divergence + Volume Spikes🧠 FVG + OB + RSI Divergence + Volume Spikes – Market Structure Confluence Tool
This all-in-one indicator brings together four powerful market concepts into a single script designed to help traders identify high-probability trade setups with precision and clarity:
🔍 What It Does
✅ Fair Value Gaps (FVG)
Highlights inefficiencies in price action, showing where the market may return to “rebalance.”
✅ Order Blocks (OB)
Marks key institutional footprints — bullish and bearish order blocks based on engulfing candle structures.
✅ RSI Divergence
Detects both bullish and bearish divergences between price and RSI, signaling potential reversals.
✅ Volume Spikes
Flags bars where volume significantly exceeds the average — a common footprint of smart money.
🎯 How to Use
Use this tool to spot confluences between price inefficiencies (FVG), key reversal zones (OB), momentum shifts (RSI Divergence), and institutional interest (Volume Spikes). The best setups often occur when multiple signals align — especially at key support/resistance or trend zones.
⚙️ Inputs
RSI length (for divergence)
Volume spike sensitivity (multiplier)
Lookback for Order Blocks and FVGs
⚠️ Notes
This is a non-repainting tool.
Ideal for price action, SMC, ICT, and order flow traders.
Combine with your existing strategy and higher time frame bias for best results.

Mr_Pips817 RSI Divergence PROBuilt for professional traders who demand precision.
The TMA - RSI Divergence PRO indicator combines high-probability divergence detection with smart liquidity-based price action levels to identify turning points, trend reversals, and entry/exit zones.
✅ Detects RSI/Momentum/Smoothed divergence
✅ Marks Buy/Sell signals with graded confidence levels
✅ Includes Best / Great / Good / Quality signal types
✅ Fully customizable oscillator levels
✅ Adjustable timeframe alert filter
✅ Invite-only & source-protected
Use it on any market: FX, crypto, indices, stocks, commodities
Optimized for scalping, intraday, and swing trading strategies.
🧠 How It Works:
Select your oscillator (RSI, Momentum, or Smoothed).
When price forms a pivot high/low and diverges from the oscillator, the system flags the divergence.
When the oscillator crosses specific liquidity zones (customizable), it triggers a Buy/Sell label.
Each signal type is visually and logically ranked by quality.
Optional: Filter alerts by your desired chart timeframe for enhanced control.
🧪 Signal Tiers Explained:
Type Signal Meaning
Best Quality Sell "Sell" Optimal sell signal (buy-side liquidity sweep)
Great Quality ⇩⇩ / ⇧⇧ Strong momentum shift
Good Quality ⇩ / ⇧ Probable trend start
Quality • (dot) Early warning / low-grade signal
🚨 Alerts & Controls:
Toggle alerts on/off per signal type
Filter alerts by timeframe
Fine-tune divergence & signal thresholds for each market
📈 Suggested Settings:
Use RSI Divergence for FX and Crypto
Use Smoothed Divergence for Indexes or higher timeframes
Tune liquidity levels based on market volatility
Triple Moving Averages + RSI Divergence + Trade Creator [CSJ7]This indicator uses triple moving averages to identify the prevailing trend, and calculates the linear regression of the closing price, and of the RSI, to either confirm the current trend direction, or to identify a potential trade reversal. Additionally, it includes a trade management tool that allows you to rate your trade setup according to your selected entry minimums and preferences, plus you obtain an estimated P&L with profitability metrics of your trade.
The key features are:
Dashboard : Includes entry/exit amounts, prices, quantities, estimated Profit & Loss, ROI, ROE, RRR, insights into market trends, entry conditions, and operational logs.
Trade Setup : Allows you to design your trade in detail. Select entry/exit levels, and let the tool suggest optimal target levels based on your ROI and RRR preferences. Specify your desired stop-loss type, and the tool will present the corresponding price.
Entry Conditions Management : Customize your trade entry prerequisites within the settings. The system evaluates these, offering a Trade Rating and displaying current values and entry statuses in the Entry Conditions table.
Trade Box : Visualize your trade strategy with a trade box that shows in alongside your chart, highlighting potential profit/loss zones and entry price points.
RSI & Close Price Linear Regressions : Calculates the linear regression of RSI and the close prices, since the beginning of the current trend, and presents them directly in the chart and alongside the active trend, to allow you to spot a potential trend continuation or reversal.
Adaptive price levels : The tool calculates the viability, trade rating and P&L based on contextual levels, like moving averages and highest or lowest prices, instead of using fixed prices; this allows for the results to adapt dynamically to market fluctuations, eliminating the need for manual recalibrations and adjustments.
Automatic Trade Side Detection : While manual input is available, the tool can intuitively determine the optimal trade side based on current data.
Market Outlook Events : By using the crossings of the three averages, the tool keeps track of the evolution of the current trend, providing points of interest like when the initial momentum is observed, when the trend initiates, when a potential entry zone starts, when a buy or sell opportunity arises and when the trend ends.
Alerts : You can set up two distinct alerts – one notifies on trend milestones and another for trade initiation conditions. Note: Manual activation is required in the Tradingview dashboard.
Logs : The tool provides a log section where you can find relevant information regarding the operation and any encountered errors via the dashboard's log section.
Usage
Choose your desired ticker and timeframe. If a tradable trend is detected and levels are set correctly, the trade box appears. Incorrect levels will trigger a warning in the error logs.
The tool will suggest the logical trade side, but manual adjustments are possible.
Customize ROI, maximum loss, and RRR in the settings. When in 'Auto', the tool will calculate the target price accordingly.
Adjust leverage to align with your risk and reward parameters.
View linear regressions for trend analysis and spotting RSI divergences.
Manage position sizing and risk in the settings, accounting for broker/exchange fees.
Activate alerts for trade notifications.
Enable 'Show Trade Levels' in settings to get the details of the necessary limit orders for the trade.
In the image below, you can view the expanded Trade Creator Dashboard, the Trade Box, and the Linear Regression Lines:
The linear regression lines are colored red when trending downward and green when trending upward.
The labels displaying information related to the entry and exit prices can be hidden, as demonstrated in the image above.

Stochastic RSI DivergencesAdapted from TradingView's RSI Divergences to instead use Stochastic RSI as the oscillator.

(JS) RSI Divergence OscillatorPretty simple really - when the oscillator is positive it means that there's bull RSI divergence, negative means there is bear RSI divergence.
Simple formula to make it, Rate of Change on RSI vs. Rate of Change on price, smoothed out using an EMA.

Stoch-RSI Divergence PointerThis script points regular and optionally hidden types of bullish and bearish Stoch-RSI divergences on the chart by drawing the divergence lines and optionally labels.
Hidden divergence is disabled by default, it can be enabled over settings window.
Regular divergence is enabled by default, it can be disabled over settings window.
There is an option to display the price channel additionally.

Imbalance RSI Divergence Strategy# Imbalance RSI Divergence Strategy - User Guide
## What is This Strategy?
This strategy identifies **imbalance** zones in the market and combines them with **RSI divergence** to generate trading signals. It aims to capitalize on price gaps left by institutional investors and large volume movements.
### Main Settings
- **RSI Period (14)**: Period used for RSI calculation. Lower values = more sensitive, higher values = more stable signals.
- **ATR Period (10)**: Period for volatility measurement using Average True Range.
- **ATR Stop Loss Multiplier (2.0)**: How many ATR units to use for stop loss calculation.
- **Risk:Reward Ratio (4.0)**: Risk-reward ratio. 2.0 = 2 units of reward for 1 unit of risk.
- **Use RSI Divergence Filter (true)**: Enables/disables the RSI divergence filter.
### Imbalance Filters
- **Minimum Imbalance Size (ATR) (0.3)**: Minimum imbalance size in ATR units to filter out small imbalances.
- **Enable Lookback Limit (false)**: Activates historical lookback limitations.
- **Maximum Lookback Bars (300)**: Maximum number of bars to look back.
### Visual Settings
- **Show Imbalance Size**: Displays imbalance size in ATR units.
- **Show RSI Divergence Lines**: Shows/hides divergence lines.
- **Divergence Line Colors**: Colors for bullish/bearish divergence lines.
### Volatility-Based Adjustments
- **Low volatility markets**:
- Minimum Imbalance Size: 0.2-0.4 ATR
- ATR Stop Loss Multiplier: 1.5-2.0
- **High volatility markets**:
- Minimum Imbalance Size: 0.5-1.0 ATR
- ATR Stop Loss Multiplier: 2.5-3.5
### Risk Tolerance
- **Conservative approach**:
- Risk:Reward Ratio: 2.0-3.0
- RSI Divergence Filter: Enabled
- Minimum Imbalance Size: Higher (0.5+ ATR)
- **Aggressive approach**:
- Risk:Reward Ratio: 4.0-6.0
- Minimum Imbalance Size: Lower (0.2-0.3 ATR)
###Market Conditions
- **Trending markets**: Higher RSI Period (21-28)
- **Sideways markets**: Lower RSI Period (10-14)
- **Volatile markets**: Higher ATR Multiplier
## Recommended Testing Procedure
1. **Start with default settings** and backtest on 3-6 months of historical data
2. **Adjust RSI Period** to see which value produces better results
3. **Optimize ATR Multiplier** for stop loss levels
4. **Test different Risk:Reward ratios** comparatively
5. **Fine-tune Minimum Imbalance Size** to improve signal quality
## Important Considerations
- **False positive signals**: Imbalances may be less reliable during low volatility periods
- **Market openings**: First hours often produce more imbalances but can be riskier
- **News events**: Consider disabling strategy during major news releases
- **Backtesting**: Test across different market conditions (trending, sideways, volatile)
## Recommended Settings for Beginners
**Safe settings for new users:**
- RSI Period: 14
- ATR Period: 14
- ATR Stop Loss Multiplier: 2.5
- Risk:Reward Ratio: 3.0
- Minimum Imbalance Size: 0.5 ATR
- RSI Divergence Filter: Enabled
## Advanced Tips
### Signal Quality Improvement
- **Combine with market structure**: Look for imbalances near key support/resistance levels
- **Volume confirmation**: Higher volume during imbalance formation increases reliability
- **Multiple timeframe analysis**: Confirm signals on higher timeframes
### Risk Management
- **Position sizing**: Never risk more than 1-2% of account per trade
- **Maximum drawdown**: Set overall stop loss for the strategy
- **Market hours**: Consider avoiding low liquidity periods
### Performance Monitoring
- **Win rate**: Track percentage of profitable trades
- **Average R:R**: Monitor actual risk-reward achieved vs. target
- **Maximum consecutive losses**: Set alerts for strategy review
This strategy works best when combined with proper risk management and market analysis. Always backtest thoroughly before using real money and adjust parameters based on your specific market and trading style.


Lower TF RSI DivergenceThis script is showing the RSI Divergences in several time frames.
The time frames are 1min, 3min, 5min, 15min and 30min.
Repaint can be expected as the script uses historical and real time data.
The script should be used on 1min chart only as the labels are not coded to
change dynamically according to the time frame users are using.

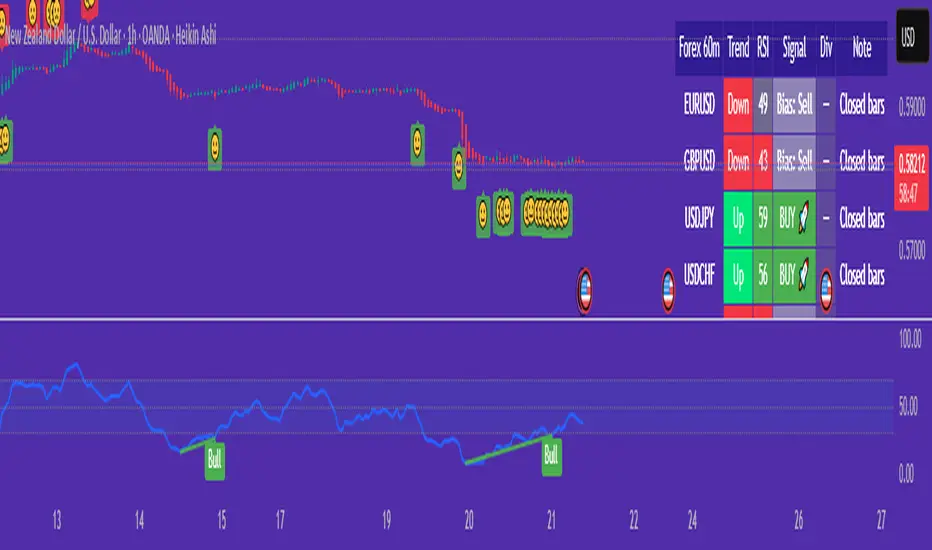
Forex 60m Simple Scanner + RSI Divergence“Forex 60m Simple Scanner + RSI Divergence”
This scanner helps beginner traders quickly identify trade opportunities across the top 10 forex pairs. It combines a simple EMA crossover system with an optional RSI filter to confirm trend direction, and adds RSI divergence detection to spot potential reversals early.
The built-in table shows each pair’s trend, RSI value, buy/sell signal, and divergence status—all in one place.
For beginners, this makes it easier to:
Avoid flipping between multiple charts.
See clear BUY/SELL 🚀 signals instead of guessing.
Spot high-probability setups with RSI divergence markers (😊/☹️).
It simplifies decision-making by turning complex signals into a straightforward dashboard that highlights where attention is needed most.
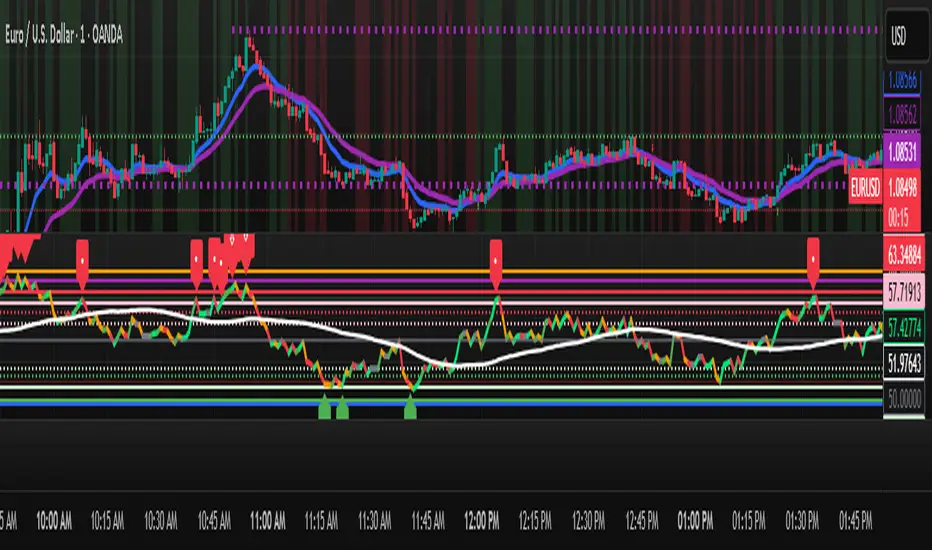
Forex 5m Simple Scanner + RSI DivergenceHello everyone. this is a easy to use indicator.
I wanted something very easy to visualize and understand. Great for the beginner's.
About this script:
“Forex 5m Simple Scanner + RSI Divergence”
This scanner helps beginner traders quickly identify trade opportunities across the top 10 forex pairs. It combines a simple EMA crossover system with an optional RSI filter to confirm trend direction, and adds RSI divergence detection to spot potential reversals early.
The built-in table shows each pair’s trend, RSI value, buy/sell signal, and divergence status—all in one place.
For beginners, this makes it easier to:
Avoid flipping between multiple charts.
See clear BUY/SELL 🚀 signals instead of guessing.
Spot high-probability setups with RSI divergence markers (😊/☹️).
It simplifies decision-making by turning complex signals into a straightforward dashboard that highlights where attention is needed most.

Caretaker's On-Chart RSI Divergence Identifier Caretakers On-Chart Rsi Div 5
This indicator is a divergence identification indicator, it uses a logic of defining a local high or low based upon multiple candle closes and then takes into account a user specified look back period to check for divergence in the RSI oscillator between two or more successive local highs/lows. RSI divergence is when price action is making two or more successive local highs or lows and the RSI oscillator makes a lower high or higher low respectively.
This indicator looks for both regular Bull & Bearish divergence as well as hidden Bull & Bearish divergence and is color coded. As default, green indicates regular bullish divergence , red indicates regular bearish divergence, orange indicates bearish hidden divergence and blue indicates hidden bullish divergence .
Dotted lines indicate that a signal is not fully confirmed but is in progress.
To request access please DM.

Caretaker's On-Pane Rsi Divergence IdentifierCaretakers On-Pane Rsi Div 5
This indicator is a divergence identification indicator, it uses a logic of defining a local high or low based upon multiple candle closes and then takes into account a user specified look back period to check for divergence in the RSI oscillator between two or more successive local highs/lows. RSI divergence is when price action is making two or more successive local highs or lows and the RSI oscillator makes a lower high or higher low respectively.
This indicator looks for both regular Bull & Bearish divergence as well as hidden Bull & Bearish divergence and is color coded. As default, green indicates regular bullish divergence , red indicates regular bearish divergence, orange indicates bearish hidden divergence and blue indicates hidden bullish divergence .
Dotted lines indicate that a signal is not fully confirmed but is in progress.
To request access please DM.
